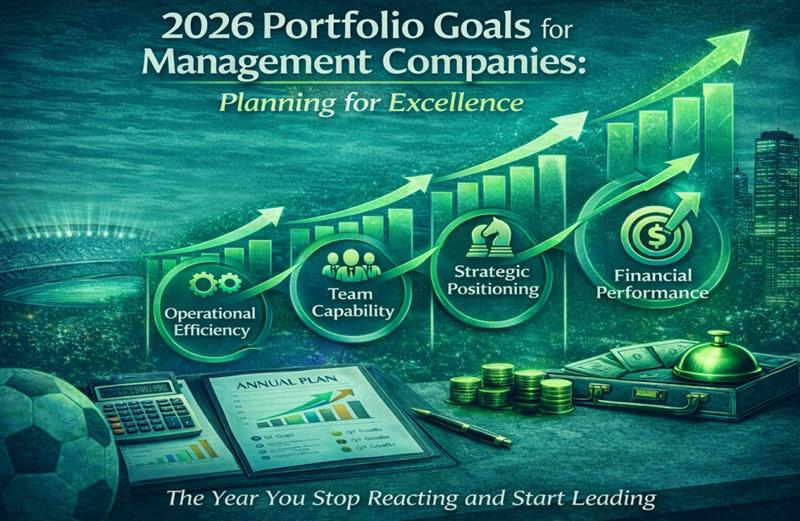
The Year You Stop Reacting and Start Leading
I was reviewing year-end performance data with a 23-property management company last December when the owner said something that stuck with me: “We hit our revenue targets, but I have no idea if we’re actually getting better at what we do.”
He wasn’t alone. Most hotel management companies measure success through lagging indicators-RevPAR growth, occupancy rates, GOP margins. Important metrics, sure. But they tell you where you’ve been, not where you’re going. And they certainly don’t tell you whether your operations are becoming more efficient, your team more capable, or your competitive position more defensible.
As we enter 2026, the management companies that will separate from the pack aren’t just setting revenue goals. They’re building systematic frameworks for operational excellence that compound year over year. This guide will show you how to set portfolio goals that drive real improvement-not just incremental gains in the same old metrics.
Why Most Portfolio Goals Fail (And What to Do Instead)
Let’s be honest about how most management companies approach annual planning:
December rolls around, you look at last year’s numbers, add 8-12% to the key metrics (RevPAR, revenue, margins), call it a plan, and move on. Then you spend the next twelve months reacting to whatever the market throws at you, hoping to hit those arbitrary targets.
Three problems with this approach:
- It’s outcome-focused, not system-focused
Revenue targets don’t tell you how to improve. They’re the scoreboard, not the playbook. When you miss a revenue goal, you have no idea whether the problem was pricing strategy, operational execution, market positioning, team capability, or just bad luck.
- It encourages short-term thinking
When your only goal is “increase RevPAR by 10%,” you optimize for quick wins that might compromise long-term value. Cutting guest experience investments to boost short-term margins. Avoiding necessary renovations to protect this year’s GOP. Under-investing in team development because it doesn’t show immediate ROI.
- It doesn’t create competitive advantage
Every management company is chasing the same outcome metrics. Revenue growth, margin expansion, occupancy gains. If everyone’s optimizing for the same things, you’re just running faster on the same treadmill. Real competitive advantage comes from building capabilities your competitors don’t have.
The alternative? Set goals across four dimensions that create a flywheel of continuous improvement:
- Operational Efficiency (how effectively you use resources)
- Team Capability (how skilled and empowered your people are)
- Strategic Positioning (how differentiated and defensible your competitive advantage is)
- Financial Performance (the outcomes that result from 1-3)
Let me break down each one.
Dimension 1: Operational Efficiency Goals
This is about doing more with what you have-not through grinding harder, but through smarter systems and better leverage.
The Metrics That Matter
Portfolio-per-Team-Member Ratio
Most management companies don’t track this, but it’s one of the most revealing efficiency indicators. Calculate your total portfolio room count divided by full-time equivalent employees (excluding property-level staff).
Industry benchmark: 50-75 rooms per corporate team member for full-service management companies.
If you’re below this range, you’re either under-leveraged (opportunity for efficiency gains) or over-servicing properties (which might be intentional for premium positioning). If you’re above it, you might be stretched thin.
Goal framework: Increase rooms-per-team-member by 10–15% while maintaining or improving service quality scores.
Time-to-Market on Strategic Decisions
How long does it take your team to implement a pricing change, launch a promotion, or respond to a competitive threat?
In 2026, speed is a competitive advantage. The companies that can spot opportunities and execute faster will capture disproportionate value.
Goal framework: Reduce average decision-to-implementation time by 30% for tactical changes, 20% for strategic initiatives.
Process Standardization Index
This one requires honest assessment: What percentage of your recurring operations (budgeting, reporting, property onboarding, performance reviews, revenue strategy development) follows documented, repeatable processes?
Most management companies operate on tribal knowledge. Your best GM has a system in their head. Your top revenue manager has spreadsheets no one else understands. When they leave, that knowledge walks out the door.
Goal framework: Document and standardize 80% of recurring operational processes by Q3 2026.
What This Looks Like in Practice
A 31-property management company I worked with last year set a goal to reduce their corporate team’s “reactive time”-hours spent firefighting, responding to urgent requests, or hunting for data-by 40%.
They invested in:
- Automated reporting dashboards (eliminated 15 hours/week of manual report generation)
- Standardized property onboarding checklist (reduced onboarding time from 6 weeks to 3.5 weeks)/li>
- Weekly asynchronous strategy reviews instead of endless meetings (saved 12 hours/week of team time)
Result after 9 months: Their VP of Operations was managing 8 more properties than the previous year with the same team size. More importantly, they had capacity to pursue a strategic acquisition they would have previously passed on.
That’s operational leverage creating strategic optionality.
Dimension 2: Team Capability Goals
Your portfolio’s performance ceiling is determined by your team’s capability ceiling. Most management companies under-invest here because the ROI is harder to measure and takes longer to materialize.
But here’s the math that changes minds: A 10% improvement in team capability can drive 15-25% improvement in outcomes when systems are in place to leverage that capability.
The Metrics That Matter
Skills Gap Analysis Score
For each critical role (GM, revenue manager, sales director, controller), assess current capability vs. required capability across key competencies. Score on a 1-5 scale.
Example for Revenue Managers:
- Strategic pricing (market positioning, competitive analysis)
- Tactical execution (rate loading, channel management, promotion design)
- Data interpretation (pace analysis, forecast accuracy, demand pattern recognition)
- Stakeholder communication (owner reporting, team collaboration)
- Technology proficiency (RMS, PMS, BI tools)
Goal framework: Reduce average skills gap by 30% across all critical roles by year-end.
Internal Promotion Rate
What percentage of leadership positions are filled by internal promotions vs. external hires?
Higher internal promotion rates indicate you’re building talent, not just renting it. They also improve retention (people stay when they see a path forward) and culture (promoted leaders understand your systems and values).
Goal framework: Fill 60%+ of senior roles and 75%+ of mid-level roles through internal promotion.
Cross-Functional Capability Index
Can your revenue managers understand P&L implications of their decisions? Can your GMs articulate revenue strategy? Can your controllers interpret market positioning?
The best management companies break down silos by building T-shaped team members-deep expertise in their domain, broad understanding of adjacent functions.
Goal framework: 100% of leadership team demonstrates proficiency in at least one adjacent functional area by Q4.
What This Looks Like in Practice
One management company implemented a “GM Revenue Academy”-a 90-day program where GMs spent 4 hours/week learning revenue management fundamentals, shadowing revenue managers, and practicing strategic pricing decisions.
Initially, it felt like an expensive distraction. But six months in, they noticed something remarkable: Properties where GMs completed the program showed 7% higher RevPAR growth than control properties-not because GMs were doing revenue management, but because they were having better strategic conversations with their revenue managers and making better operational trade-offs.
The academy cost $35K to develop and run. The incremental revenue impact across their portfolio was $890K annualized.
Dimension 3: Strategic Positioning Goals
This is the dimension most management companies ignore entirely when setting goals. Yet it’s the one that determines whether you’re building a commodity business or a defensible competitive advantage.
The Metrics That Matter
Win Rate on Target Acquisitions
When you pursue new management contracts or acquisitions in your ideal customer profile, what percentage do you actually close?
Low win rates (sub-30%) suggest weak positioning-you’re competing on price or you’re not differentiated. High win rates (60%+) suggest strong positioning-owners are choosing you for reasons beyond cost.
Goal framework: Increase win rate on target deals from X% to Y% (most companies should target 50%+ for ideal-fit opportunities).
Competitive Moat Depth
This requires qualitative assessment: What would a competitor need to replicate to match your value proposition?
Strong moats come from:
- Proprietary technology or systems
- Specialized expertise in a niche (select-service conversion, lifestyle brands, resort operations)
- Network effects (multi-property relationships with brands, vendors, or distribution partners)
- Brand reputation in specific markets or segments
Goal framework: Identify and invest in strengthening at least 2 moat elements in 2026.
Client Concentration Risk
What percentage of your revenue comes from your top 3 clients or top property?
High concentration creates fragility. One owner decides to switch management companies or sell, and you’re scrambling.
Goal framework: Reduce top-3 client concentration to below 40% of total revenue.
What This Looks Like in Practice
A management company specializing in select-service conversions realized they were competing primarily on price-their win rate was 28% and margins were compressing.
They made a strategic decision: Instead of being “good at select-service,” they’d become the undisputed experts in adaptive reuse conversions-taking non-hotel buildings (offices, retail, industrial) and converting them to select-service hotels.
They invested in:
- Developing proprietary feasibility analysis tools for adaptive reuse economics
- Building relationships with specialized architects and contractors
- Creating case study content showcasing their unique projects
- Training their team on adaptive reuse-specific operational considerations
Eighteen months later: Win rate on adaptive reuse projects hit 67%. They commanded 15-20% premium fees vs. standard select-service management. And they had a pipeline they could be selective about because owners sought them out specifically for this capability.
That’s strategic positioning creating pricing power.
Dimension 4: Financial Performance Goals
Now we get to the outcomes-but notice these come last, not first. When you improve operational efficiency, team capability, and strategic positioning, financial performance follows naturally.
Beyond RevPAR: The Metrics That Tell the Real Story
GOP Margin Trend vs. Market
Don’t just track absolute GOP margin-track it relative to your competitive set. Are you gaining or losing ground?
A property showing 32% GOP in a market averaging 28% is doing great. The same 32% in a market averaging 38% is a problem, even if it’s “good” in isolation.
Goal framework: Maintain or expand GOP margin gap vs. market by 1-2 percentage points.
Revenue Diversification Index
What percentage of total revenue comes from rooms vs. non-rooms sources (F&B, ancillary services, parking, etc.)?
Over-dependence on rooms revenue creates vulnerability to occupancy shocks. The best operators find ways to monetize beyond the bedroom.
Goal framework: Increase non-rooms revenue contribution by 2-3 percentage points.
Owner Satisfaction Score
I’m consistently surprised how few management companies systematically measure this. Your owners are your customers-shouldn’t you know if they’re happy?
Implement quarterly owner satisfaction surveys covering: communication quality, financial performance vs. expectations, responsiveness, strategic partnership.
Goal framework: Achieve 85%+ owner satisfaction score (9-10 on 10-point scale) across portfolio.
Net Revenue Retention Rate
This SaaS metric applies perfectly to management companies. Of the revenue you had in 2025, how much persists in 2026 after accounting for lost contracts, added properties from existing owners, and rate changes?
100% = break even (lost revenue = gained revenue)
100% = growing from existing base <100% = churning faster than expanding Goal framework: Achieve 105-110% net revenue retention (modest growth from existing relationships before new business).
The Compound Effect
Here’s where it gets interesting. When you improve across all four dimensions simultaneously, the effects multiply rather than add.
A management company that:
- Improves operational efficiency by 15% (can manage more with same resources)
- Upgrades team capability by 20% (better decisions, better execution)
- Strengthens strategic positioning (wins better deals, commands premium fees)
- … doesn’t just see 15-20% financial improvement
They see 35-50% improvement because the gains compound. Better positioning attracts better properties. Better properties give your team better experience. Better experience creates better systems. Better systems allow you to take on more premium properties. The flywheel spins.
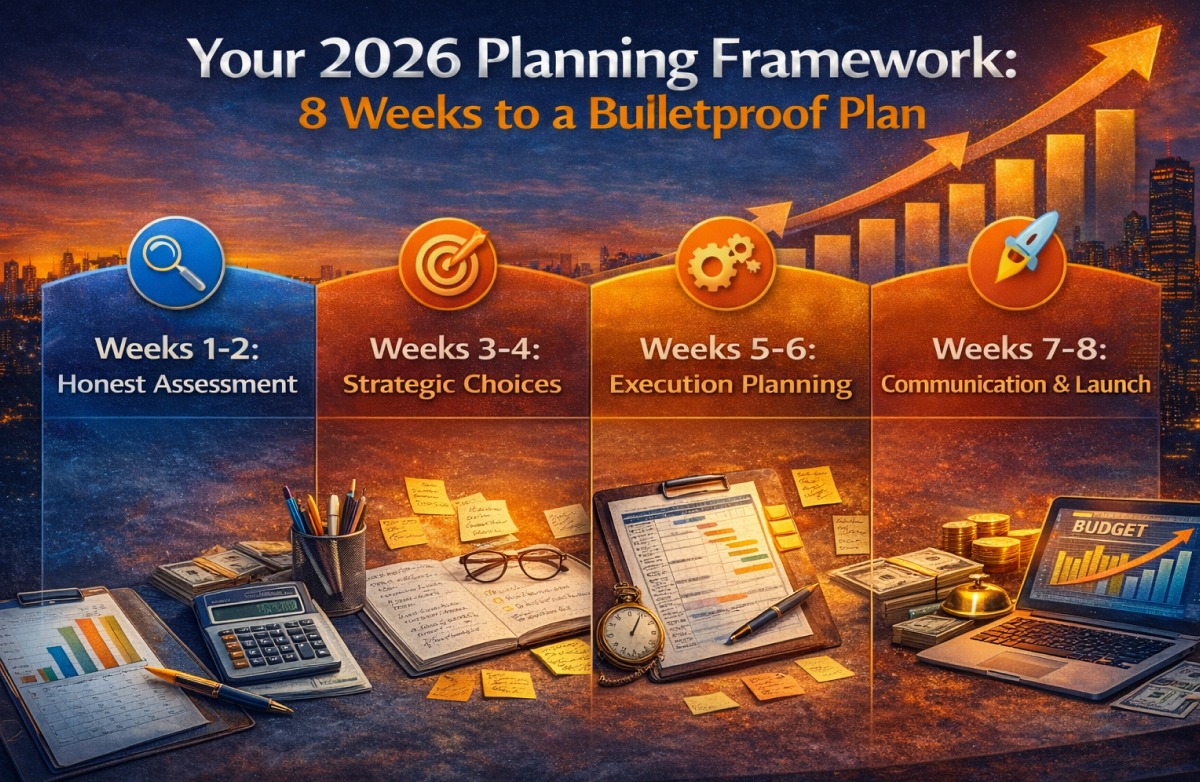
Your 2026 Planning Framework: 8 Weeks to a Bulletproof Plan
Most management companies spend 2-3 days on annual planning-a rushed December sprint that produces generic goals no one really believes in.
Here’s a better approach. Eight weeks, systematically building a plan your team will actually execute.
Weeks 1–2: Honest Assessment
Week 1: Performance Audit
- Pull 2025 data across all four dimensions
- Calculate current state metrics for each category
- Identify top 3 wins and top 3 disappointments
- Survey team for candid input on what’s working and what’s not
Week 2: Competitive Benchmarking
- Compare your metrics to industry benchmarks where available
- Assess competitive positioning honestly (where do you win? where do you lose?)
- Identify capability gaps vs. best-in-class operators
- Review client feedback and lost deal post-mortems
Weeks 3–4: Strategic Choices
Week 3: Priority Identification
- Based on weeks 1-2, identify highest-leverage improvement opportunities
- Categorize as: Quick wins (0-3 months), medium-term (3-9 months), long-term (9-24 months)
- Assess resource requirements (time, money, people) for each
- Evaluate strategic fit (does this align with where we want to be in 3 years?)
Week 4: Goal Setting
- Set specific, measurable goals across all four dimensions
- Ensure goals are balanced (not all financial, not all long-term)
- Pressure-test with team: Are these achievable? Are we willing to make trade-offs to hit them?
- Establish leading indicators for each goal (what would tell us we’re on track at 90 days?)
Weeks 5–6: Execution Planning
Week 5: Initiative Design
- For each goal, define 2-4 key initiatives required to achieve it
- Assign initiative owners (not committees-single points of accountability)
- Build high-level project plans with milestones
- Identify dependencies and potential obstacles
Week 6: Resource Allocation
- Map resource requirements across all initiatives
- Identify conflicts (same people on too many projects)
- Make hard choices (what are we NOT doing to create capacity?)
- Build budget for new investments (technology, training, outside expertise)
Weeks 7–8: Communication and Launch
Week 7: Stakeholder Alignment
- Present plan to ownership/board for buy-in and feedback
- Refine based on input
- Create simplified version for property-level teams
- Develop communication strategy for rolling out to full organization
Week 8: Implementation Kickoff
- Launch with company-wide communication of vision and goals
- Hold initiative kickoff meetings with project teams
- Establish cadence for progress reviews (I recommend monthly for strategic goals, weekly for tactical initiatives)
- Set up tracking dashboard for key metrics
The Metrics Dashboard You Need
All these goals are useless if you can’t track progress. Here’s the simple dashboard framework I recommend:
Monthly Executive Dashboard (One Page)
Section 1: Financial Performance
- Portfolio-wide RevPAR vs. budget and prior year
- GOP margin trend
- Net revenue retention rate
- Pipeline value (new opportunities)
Section 2: Operational Efficiency
- Rooms-per-team-member ratio
- Decision-to-implementation speed (sample of recent initiatives)
- Process standardization progress (% complete)
Section 3: Team Capability
- Skills gap closure progress
- Internal promotion rate (rolling 12 months)
- Key position vacancy rate
Section 4: Strategic Positioning
- Win rate on target opportunities
- Client concentration percentage
- Owner satisfaction score trend
Section 5: Initiative Progress
- Status of top 10 strategic initiatives (green/yellow/red)
- Key milestones achieved this month
- Blockers requiring leadership attention
This fits on one page. Review it monthly with leadership. Update quarterly with full team.
Common Planning Pitfalls to Avoid
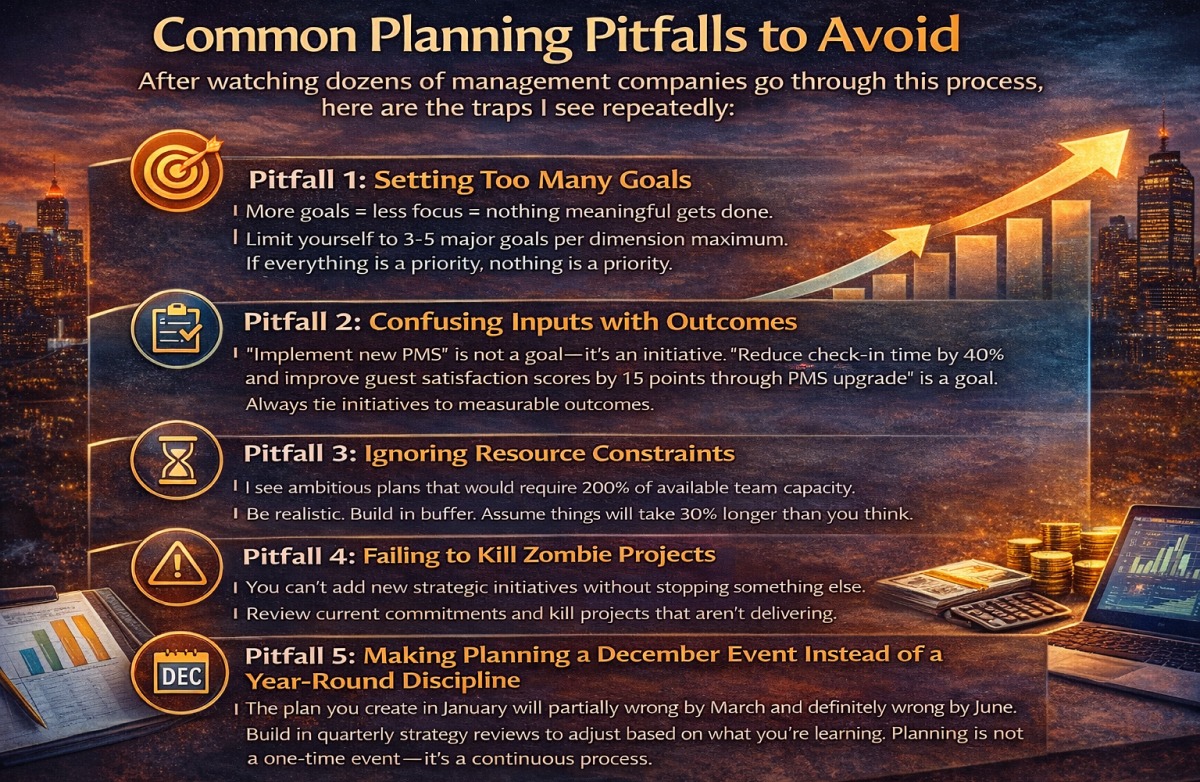
After watching dozens of management companies go through this process, here are the traps I see repeatedly:
Pitfall 1: Setting Too Many Goals
More goals = less focus = nothing meaningful gets done. Limit yourself to 3-5 major goals per dimension maximum. If everything is a priority, nothing is a priority.
Pitfall 2: Confusing Inputs with Outcomes
“Implement new PMS” is not a goal-it’s an initiative. “Reduce check-in time by 40% and improve guest satisfaction scores by 15 points through PMS upgrade” is a goal. Always tie initiatives to measurable outcomes.
Pitfall 3: Ignoring Resource Constraints
I see ambitious plans that would require 200% of available team capacity. Be realistic. Build in buffer. Assume things will take 30% longer than you think.
Pitfall 4: Failing to Kill Zombie Projects
You can’t add new strategic initiatives without stopping something else. Review current commitments and kill projects that aren’t delivering. Be ruthless about protecting capacity for what matters most.
Pitfall 5: Making Planning a December Event Instead of a Year-Round Discipline
The plan you create in January will be partially wrong by March and definitely wrong by June. Build in quarterly strategy reviews to adjust based on what you’re learning. Planning is not a one-time event-it’s a continuous process.
What Success Looks Like in December 2026
Let me paint two pictures of December 2026 for you.
Scenario A: Transactional Success
You hit your RevPAR budget. Occupancy was up 3 points. Margins expanded by 1.5%. You added 4 properties to the portfolio. Everyone gets a modest bonus. You feel… fine. Not great, not terrible. Fine.
But you have nagging questions: Could we have done better with a different strategy? Did we just get lucky with market conditions? Are we any more prepared for 2027 than we were for 2026? Would losing our top revenue manager crater our results?
Scenario B: Strategic Success
Your financial numbers are strong (likely better than Scenario A because of compound effects). But more importantly:
- You’re managing 12% more properties with only 6% headcount growth (operational leverage is real)
- Your team completed a comprehensive skills development program and internal promotion rate hit 70%
- You won 3 high-value contracts over better-known competitors because of your differentiated positioning
- Your owner satisfaction scores increased from 7.8 to 9.1 average
- You have documented, repeatable systems for 85% of your operations
- When you lost a key team member in Q3, they were replaced internally within 2 weeks with minimal disruption
Which scenario would you rather live?
The difference isn’t luck. It’s intentional planning across all four dimensions of excellence, executed with discipline throughout the year.
Your Next Step
Here’s my challenge: Block 3 hours this week for the honest assessment that starts this process.
Pull your 2025 performance data. Calculate your current state across the metrics that matter. Survey your team for candid input. Get brutally honest about where you actually are vs. where you want to be.
Most management company owners skip this step because it’s uncomfortable. It reveals gaps they’d rather not acknowledge. But you can’t improve what you won’t measure, and you can’t plan effectively from a foundation of wishful thinking.
The management companies that will dominate 2026 and beyond aren’t the ones with the most properties or the biggest portfolios. They’re the ones building systematic competitive advantages through operational excellence, team development, strategic positioning, and disciplined execution.