In an increasingly competitive hospitality environment, successful revenue management depends on more than knowing today’s market rate. It requires a clear understanding of how pricing decisions evolve over time, how they align with future demand, and how effectively they position the hotel against its competitive set.
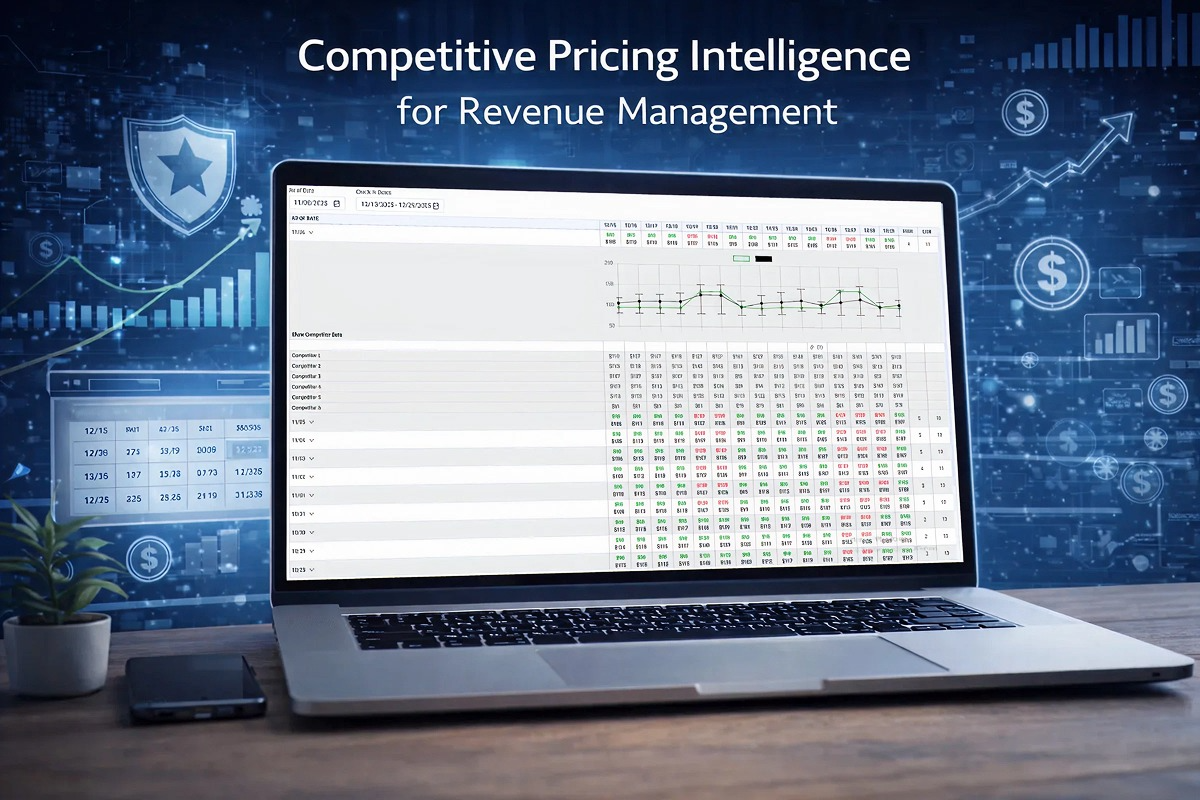
The Benchmarking Widget is purpose-built to deliver this depth of insight. By combining historical pricing snapshots, forward-looking stay-date analysis, and detailed competitor visibility, it enables revenue teams to evaluate pricing with context, confidence, and strategic intent.
As-of Date Perspective
Each row in the widget represents an As-of Date, capturing a precise snapshot of pricing as it stood on that specific day. By presenting up to the last 15 days, the widget allows revenue managers to study the trajectory of pricing decisions, not just isolated outcomes.
This perspective enables teams to assess:
- The timing and frequency of rate changes
- Whether pricing actions were anticipatory or reactionary
- Consistency between executed pricing and the hotel’s revenue strategy
By reviewing multiple As-of Dates together, revenue leaders gain visibility into pricing discipline and the effectiveness of decision-making over time.
Check-in Date Outlook
Each column represents a future Check-in Date, typically covering the upcoming 15-day demand window. This outlook shifts attention away from retrospective analysis and toward revenue opportunity management.
Evaluating rates across future stay dates helps revenue managers:
- Anticipate periods of high or soft demand
- Identify early signs of compression
- Apply premium pricing where market conditions and demand signals justify it
This structure ensures pricing decisions are guided by forward-looking demand intelligence rather than historical performance alone.
Self Rate Positioning vs Market
For every As-of Date and Check-in Date combination, the widget clearly highlights how the hotel is positioned relative to the market:
- Green self rate indicates the hotel is priced below the competitor average, signaling a value-led or occupancy-focused approach.
- Red self rate indicates the hotel is priced above the competitor average, reflecting a premium or confidence-driven strategy supported by demand strength, brand positioning, or compression.
The competitor average rate, displayed directly beneath the self rate, provides immediate market context and removes the need for interpretation or calculation. This design allows revenue managers to instantly validate whether pricing aligns with strategic intent.

Market Trend Visualization
The integrated rate trend chart translates detailed rate data into a concise visual narrative:
- The green line represents the hotel’s pricing movement
- The black line represents the competitor average
- The upper and lower bands define the market’s maximum and minimum competitor rates
This visualization illustrates how assertively or conservatively the hotel is positioned within the market range. It helps uncover opportunities to optimize rates upward when headroom exists and flags potential exposure when pricing moves beyond market tolerance.

Competitor-Level Rate Transparency
The competitor data section provides a full breakdown of individual hotel rates within the competitive set for the selected As-of Date and Check-in Dates. This transparency allows revenue teams to move beyond aggregated averages and understand true market behavior.
With this level of detail, revenue managers can:
- Benchmark directly against comparable brands
- Identify pricing leaders, followers, and outliers
- Refine positioning based on product strength, location, and value proposition
Such insight supports more deliberate, defensible, and market-aligned pricing decisions.

High–Low Indicators
The High and Low columns provide a concise summary of pricing behavior across the grid:
- HIGH reflects the count of red rates, indicating how often the hotel was priced above the competitor average.
- LOW reflects the count of green rates, indicating how often the hotel was priced below the competitor average.
Together, these indicators offer an immediate read on overall pricing posture:
- A higher HIGH count suggests a more aggressive or premium-led approach
- A higher LOW count suggests a more competitive or occupancy-driven strategy
This summary view allows revenue leaders to quickly evaluate whether pricing behavior over the selected period aligns with broader revenue objectives.
The Benchmarking Widget is not merely a rate comparison tool-it is a pricing intelligence framework. It enables hotels to understand how pricing decisions evolve, how they align with competitive dynamics, and how effectively they capitalize on future demand.
In a market where timing and positioning are as critical as price itself, this level of insight is essential for sustaining competitive advantage and maximizing revenue performance.