Walk into any hotel GM or Revenue Manager’s office and you’ll likely see the same sight - multiple spreadsheets open, dashboards flashing, and a manager trying to make sense of what the next few weeks will look like.
Forecasting demand has always been part art, part science. But with market conditions changing by the hour, relying on static reports and manual updates often means you’re making yesterday’s decisions with today’s data.
That’s exactly why we built the Demand Calendar inside RevEVOLVE - to give hoteliers a clear, visual, and intelligent way to see what’s ahead before it’s too late to act.
Understanding the Hotelier’s Daily Challenge
Every GM and RM knows that managing room inventory isn’t just about watching pickup - it’s about anticipating when and why demand will rise or fall.
Here’s what typically makes that hard:
- Data is scattered across PMS, RMS, and spreadsheets.
- Forecasting tools don’t account for pace changes, segments, or real-time shifts.
- There’s no simple way to align teams around what the next 7, 30, or 90 days look like.
The result? Missed opportunities, over-discounting, or worse - leaving money on the table when demand was right in front of you.
The Demand Calendar solves exactly that.
What Is the Demand Calendar?
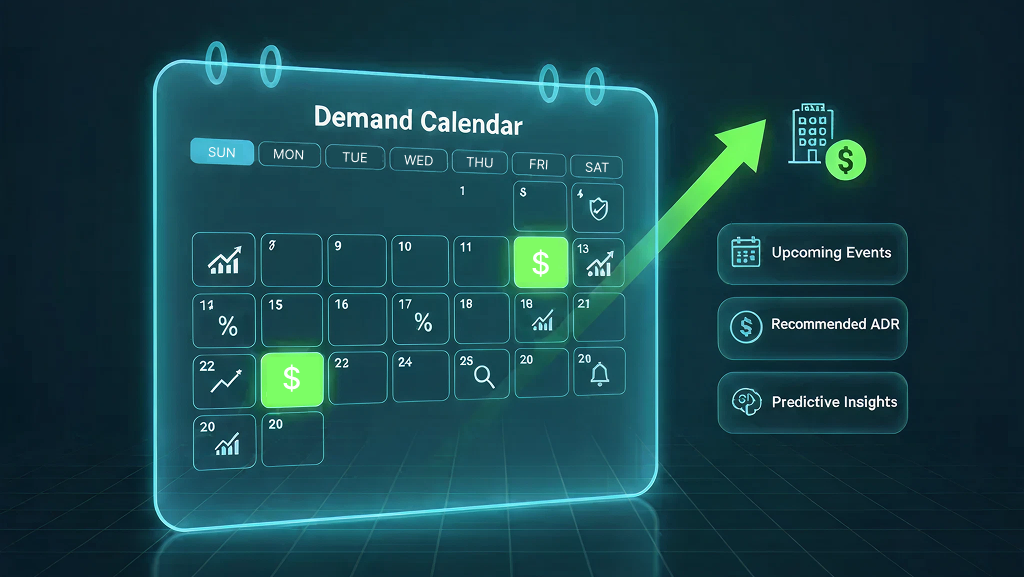
The Demand Calendar is more than just a forecast view - it’s your hotel’s heartbeat in one screen.
It visually displays how demand is shaping up across the next 90 days, showing:
- On the Books (OTB) numbers versus Forecasted Rooms
- Occupancy percentages and Average Daily Rate (ADR) trends
- Revenue projections by date range
- Pickup data - both 1-day and 7-day trends
- Market segment breakdowns to show where your bookings are really coming from
In short, it tells you what’s filling up, what’s lagging, and what’s next - all without jumping between multiple systems or spreadsheets.
How It Works - The GM & RM View
Let’s take a real example from one of our properties: Hyatt Place Chicago/Itasca using the Demand Calendar.
At a glance, the GM sees:
- Occupancy pacing at 86% for the week,
- ADR hovering around $140,
- The next 7 days of pickup totaling 18 rooms,
- And weekend dates highlighted in deeper shades (indicating stronger demand).
On the same screen, the Revenue Manager sees the segment contribution below - Corporate Negotiated, Group, Retail, OTA - helping them understand who is driving that demand.
In just a few clicks, they can identify:
- Which days are likely to sell out early,
- Which need tactical rate adjustments, and
- Which segments to focus on for upselling or discount control.
It’s not just a forecast - it’s a daily playbook for better decisions.
Why Every GM Should Use the Demand Calendar
For General Managers, time is the one thing you never have enough of.
You don’t need to dig through reports; you need clarity.
The Demand Calendar gives you that clarity - instantly.
In one view, you can understand your property’s performance trajectory for the next 90 days.
You can identify soft periods, evaluate price effectiveness, and ensure your teams are aligned on how to handle the upcoming weeks.
No more asking, “How are we pacing next month?” - it’s all there, color-coded and visualized.
Why Revenue Managers Rely on It
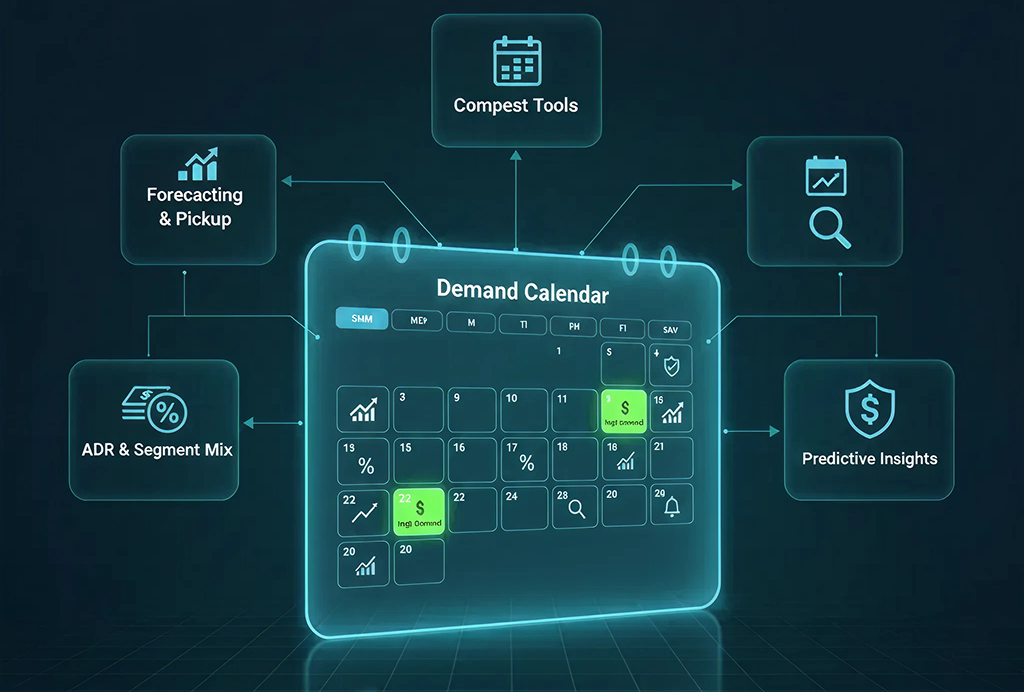
For Revenue Managers, the Demand Calendar is like a command center.
It combines forecasting, pickup, ADR movement, and segment mix into one unified space - saving hours of manual compilation.
Instead of toggling between booking pace, forecast reports, and comp set tools, you can simply open the calendar and get all the answers you need.
With daily pickup and segment-level views, you can proactively adjust your price ladders, manage inventory restrictions, or even spot cancellation risk before it impacts your revenue.
This means less guessing, more acting.
Integrating AI with Human Insight
What makes the Demand Calendar truly unique is how it integrates with RevEVOLVE’s Smart Signals and RM Copilot.
When you notice an anomaly - for instance, ADR rising but occupancy dipping - you can ask RM Copilot directly:
“Why is occupancy dropping for next weekend?”
And within seconds, it provides context:
- Slower pickup in OTA channels,
- Increased cancellations in group bookings, or
- Compset price undercut detected.
It’s like having a revenue analyst by your side 24/7.
A Visual Forecast That’s Actionable
Here’s the thing - most forecasting tools show you numbers.
The Demand Calendar shows you direction.
The color-coded design highlights periods of low, medium, and high demand so you can act early:
- Yellow and orange periods? Time to push targeted campaigns.
- Deep blue or red zones? Consider rate adjustments or distribution strategy changes.
And because it’s linked with RevEVOLVE’s PaceIQ and Pickup Analysis, every color on the calendar is backed by data, not guesswork.
The Bottom Line
For hoteliers, forecasting shouldn’t feel like reading a weather chart.
It should be clear, dynamic, and actionable.
The Demand Calendar makes it possible for GMs and RMs to anticipate shifts, align strategies, and make confident pricing and distribution decisions - all in one screen.
Because when you can see tomorrow today, you don’t just react to the market - you lead it.
Ready to see how the Demand Calendar can transform your revenue planning?
Book a personalized demo at www.revevolve.ai and experience RevEVOLVE in action.