Introduction
When FIFA World Cup 2026 was announced, most hoteliers immediately focused on one thing: host cities.
That’s natural. Matches bring fans. Fans bring demand. Demand brings pricing power.
But history tells a more nuanced story.
Across the last three FIFA World Cups, some of the strongest revenue performance didn’t come from hotels closest to stadiums. It came from properties that understood how demand spreads, how fans move between cities, and how pricing mistakes in host markets create opportunity elsewhere.
World Cup demand doesn’t sit still. It migrates. It spills over. And it arrives late.
In this blog, we break down the World Cup 2026 demand map, explain the difference between host and spillover cities, share what past tournaments taught us using real numbers, and outline how hotels should position pricing and inventory to avoid missing one of the biggest revenue opportunities of the decade.
Understanding World Cup Demand Behavior (Why Geography Matters)
World Cup demand is network-driven, not city-contained.
Fans follow teams, not hotel ZIP codes. They choose cities based on:
- Match schedules
- Travel connectivity
- Rate availability
- Inventory pressure in host markets
In Brazil 2014, hotels in Rio and São Paulo saw ADR increases of 60–110% on peak match nights, but nearby cities captured 30–50% ADR uplift when host-city pricing overshot demand.
In Russia 2018, secondary cities experienced booking window compression to 7–10 days as fans relocated between match locations. Hotels that stayed flexible outperformed early-priced competitors by 20–40% in RevPAR.
The lesson is consistent:
World Cup demand spreads outward, and hotels that prepare for this movement win.
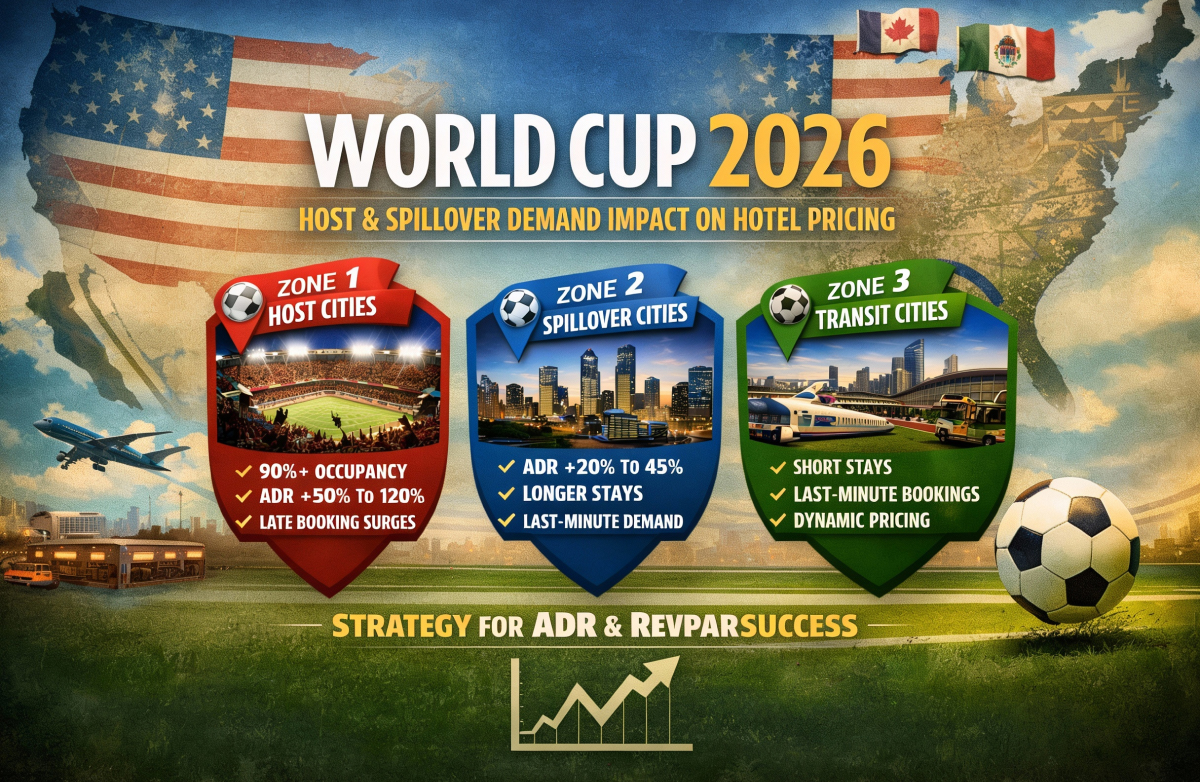
Zone 1: Primary Host Cities

Primary host cities will experience the strongest demand, but not evenly.
What the data shows
- Occupancy above 90% on high-profile match nights
- ADR uplift typically ranging from +50% to +120%
- Late booking surges driven by team progression
- Sharp variance between group-stage and knockout matches
Why host cities still underperform
Many host-city hotels make the same mistake: uniform pricing.
Lower-profile group matches often fail to justify “World Cup rates,” leading to late discounting. In past tournaments, hotels that priced every World Cup night aggressively lost pricing flexibility and diluted RevPAR.
Pricing strategy that works
- Price by match window, not by month
- Protect premium inventory early
- Push rates only after pickup confirms
- Avoid blanket World Cup markups
Host cities win by being precise, not aggressive.
Zone 2: Spillover Cities (The Quiet Winners)
")
Spillover cities are typically within driving distance or short flights from host cities. Historically, these markets quietly outperform expectations.
What the numbers tell us
- ADR uplift of +20% to +45%
- Longer average length of stay
- Higher price sensitivity early, lower sensitivity late
- Demand surges inside 14 days to arrival
In multiple World Cups, spillover cities benefited when host markets sold out or overreached on pricing. Fans adjusted, hotels that stayed flexible captured the upside..
Pricing strategy that works
- Do not mirror host-city pricing early
- Maintain flexible BAR positioning
- Watch host-city rate gaps and sell-out signals
- Move quickly once spillover demand appears
Spillover markets win through patience and speed.
Zone 3: Transit and Hub Cities

Transit cities are often underestimated but highly profitable during World Cups.
Historical behavior
- Short stays (1–2 nights)
- Highly volatile booking patterns
- Strong last-minute international demand
- Weekday compression
During Qatar 2022, hotels near major transit hubs outperformed stadium-adjacent hotels due to flexible stay patterns and late-arriving demand.
Pricing strategy that works
- Dynamic pricing close to arrival
- Minimal LOS restrictions
- Strong OTA and direct visibility
- Daily pickup monitoring
These markets reward responsiveness.
Lead Magnet / CTA
Preparing for World Cup 2026?
We’re releasing a free FIFA World Cup 2026 Hotel Revenue Playbook covering city-by-city demand signals, match-level pricing tactics, and inventory protection strategies.
Get early access or book a strategy call with our revenue team
What This Means for Hotels Right Now
You don’t need exact occupancy forecasts today.
You need clarity on your role in the demand map.
Every hotel should already know:
- Am I a host, spillover, or transit market?
- Which match nights deserve patience?
- Where late demand is most likely to originate?
- Which nights are volume-driven vs rate-driven?
Hotels that answer these questions early don’t chase demand.
They price it correctly when it shows up.
They price it correctly when it shows up.
World Cup demand moves fast and unevenly.
RevEVOLVE helps hotels:
- Track pickup and booking window compression by date
- Compare host and spillover market rate gaps
- Identify early spillover signals
- Adjust pricing dynamically with confidence
As this World Cup series continues, we’ll reference how these signals appear inside RevEVOLVE dashboards and how to act on them before competitors do.
Conclusion
World Cup 2026 will not reward assumptions.
It will reward preparation.
Host cities won’t be the only winners. Spillover and transit markets will capture significant revenue if they stay flexible and informed.
The mistake isn’t missing demand.
It’s mispricing the nights that matter most.
Before diving deeper, it’s worth revisiting where this series began in FIFA World Cup 2026: Why Match Windows Will Define Hotel Pricing Success, which explains why thinking by match, not by month, is the foundation for every pricing decision that follows.
In the next blog, we’ll tackle inventory protection and early pricing traps, using real examples from past World Cups where hotels committed too early and paid the price.
Frequently Asked Questions (FAQs)
Yes. Past World Cups show consistent spillover ADR uplift when host cities overshoot pricing or sell out.
No. Early fixed pricing removes flexibility and often leads to missed late demand.
Knockout-stage demand often compresses inside 7–10 days, sometimes even closer.
No. Independent and limited-service hotels often benefit the most from spillover demand.